Introduction
Following the passing of the great Willie Mays a few weeks ago, many highlights of his best plays have been featured in the media. The most well-known, and considered one of the greatest plays in baseball history, is his famous catch with his back turned to home plate during Game 1 of the 1954 World Series at the Polo Grounds in Manhattan.
Interestingly, a recent ESPN Sport Science breakdown concluded that, based on the launch angle, flight time, and atmospheric conditions, the ball came off Vic Wertz’s bat at an estimated 106.8 mph. My immediate thought upon seeing this number was that there is no way the exit velocity of that ball could have been determined with such precision using 1954 footage. Unfortunately, no details of ESPN’s assumptions in their analysis are provided, making it difficult to assess the validity of that claim.
Since I had conducted a very detailed analysis of Daryl Strawberry’s moonshot at Olympic Stadium using 1988 footage, physicist Alan Nathan suggested on social media that I perform a similar analysis of « The Catch » to see with how much precision it is actually possible to determine the exit velocity. With too much time on my hands (or perhaps caught in an intense phase of procrastination), I decided to take a deep look at the footage to see what could be said about it.
Hold on to your hats; below is probably the deepest and most useless analysis of « The Catch » you will ever see. Why did I do it? Because I can, and mostly because it’s fun (for the pleasure of finding things out, as the famous physicist Richard Feynman would say).
Facts and assumptions
As you can imagine, numerous assumptions will need to be made along the way. In the spirit of good science, I will be as thorough as possible and provide all the details of my analysis in what follows.
The Catch happened in the eighth inning of a game that started at 1 PM. It is thus reasonable to assume that The Catch happened sometime between 3 and 4 PM. According to measurements taken at the LaGuardia Airport station, about 5 miles from the Polo Grounds, the temperature was 71°F (21.7°C) and the pressure was 30.15 inches of mercury (102.1 kPa), which allows us to estimate the air density at about 1.2 kg/m³. Additionally, the recorded wind speed at the airport was about 16 mph from the northeast. However, it is unlikely that the wind was that strong inside the stadium. Since it is not possible to know the actual wind speed at that time and place, I will assume there was no wind, keeping in mind that this hypothesis may need to be revisited later.
The ball was hit by a left-handed batter and caught in center field, slightly towards right field. According to an analysis by physicist Alan Nathan, such balls tend to have very little, if any, sidespin. Therefore, I will assume pure backspin for my analysis.
The ESPN Sport Science breakdown reevaluated the distance the ball traveled to 421 feet.
This excellent video by Foolish Baseball estimated that the flight time was about 5.7 seconds.
What we do not know
- Exit velocity
- Launch angle
- Launch direction (or spray angle)
- Spin rate and spin axis
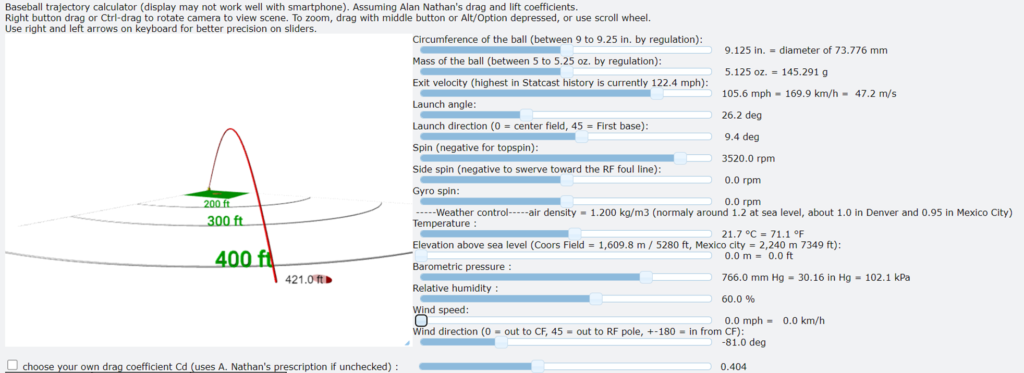
- Exact ball properties: Since each ball is unique, there might be significant variation caused by uncertainties in the exact mass, radius, and drag and lift coefficients of the ball. I will assume the ball has a mass of 5.125 oz and a diameter of 9.125 inches (middle of the range allowed by regulation) and use the drag and lift coefficients prescribed by Alan Nathan.
Given all that, let’s try to extract as much information as possible from the available data.
The analysis
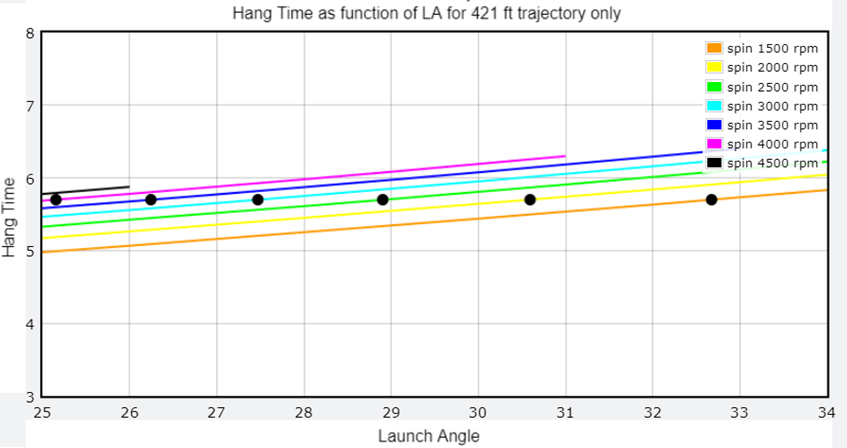
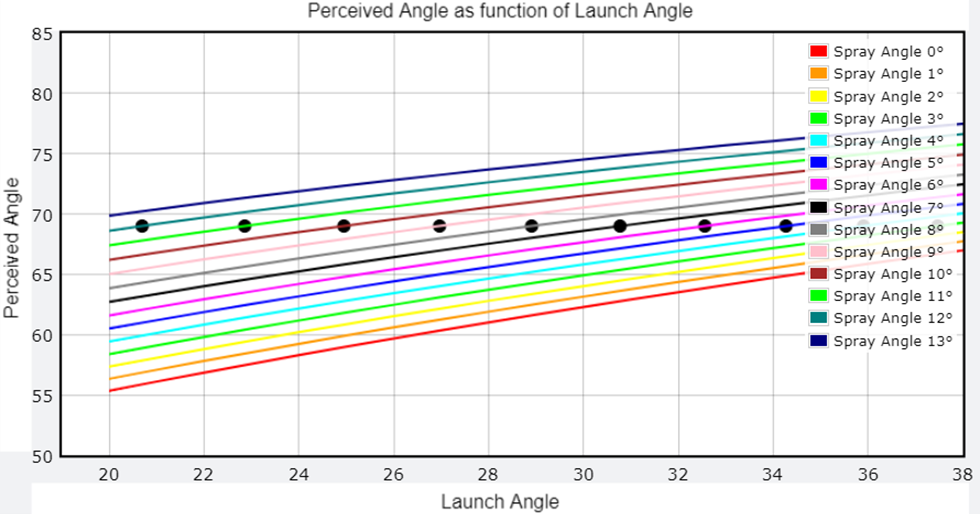
I start by calculating, using my trajectory simulator, the distance traveled as a function of exit velocity for various launch angles. The plot below shows the result of such calculations for a fixed spin rate of 1500 rpm. Since we have the constraint that the ball traveled 421 ft, only one exit velocity is permitted for each launch angle (marked by black dots).
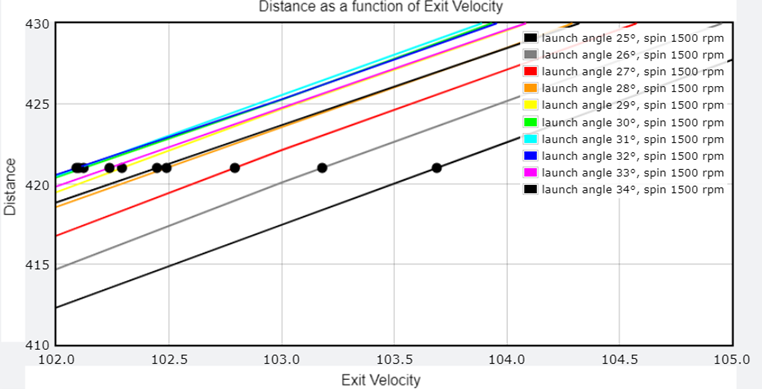
Each of these points also has a hang time associated with it. Plotting those hang times as a function of launch angle, we see that only one is compatible with the measured flight time of 5.7 seconds (black dot).
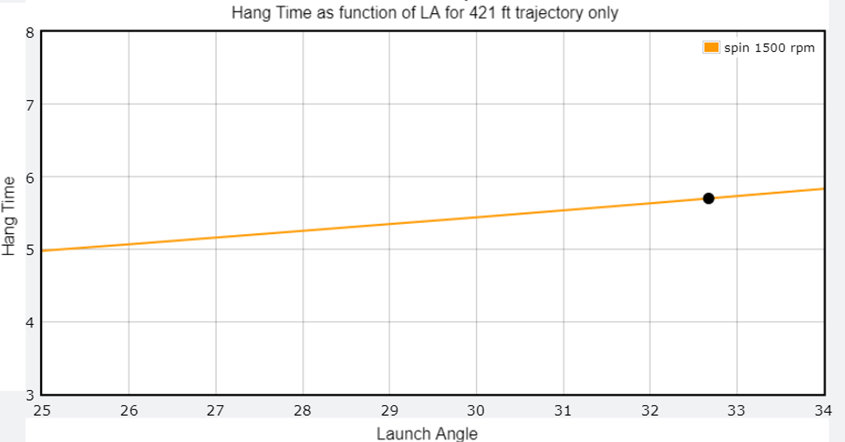
Thus, if the spin rate was 1500 rpm, then a launch angle of 32.7 degrees and an exit velocity of 102.2 mph would be the only solution compatible with the distance and flight time measurements. But 1500 rpm was just an assumption; we do not know what the spin rate was. Repeating the above procedure for spin rates between 1500 and 4500 rpm, we find multiple spin rate/launch angle combinations are allowed.
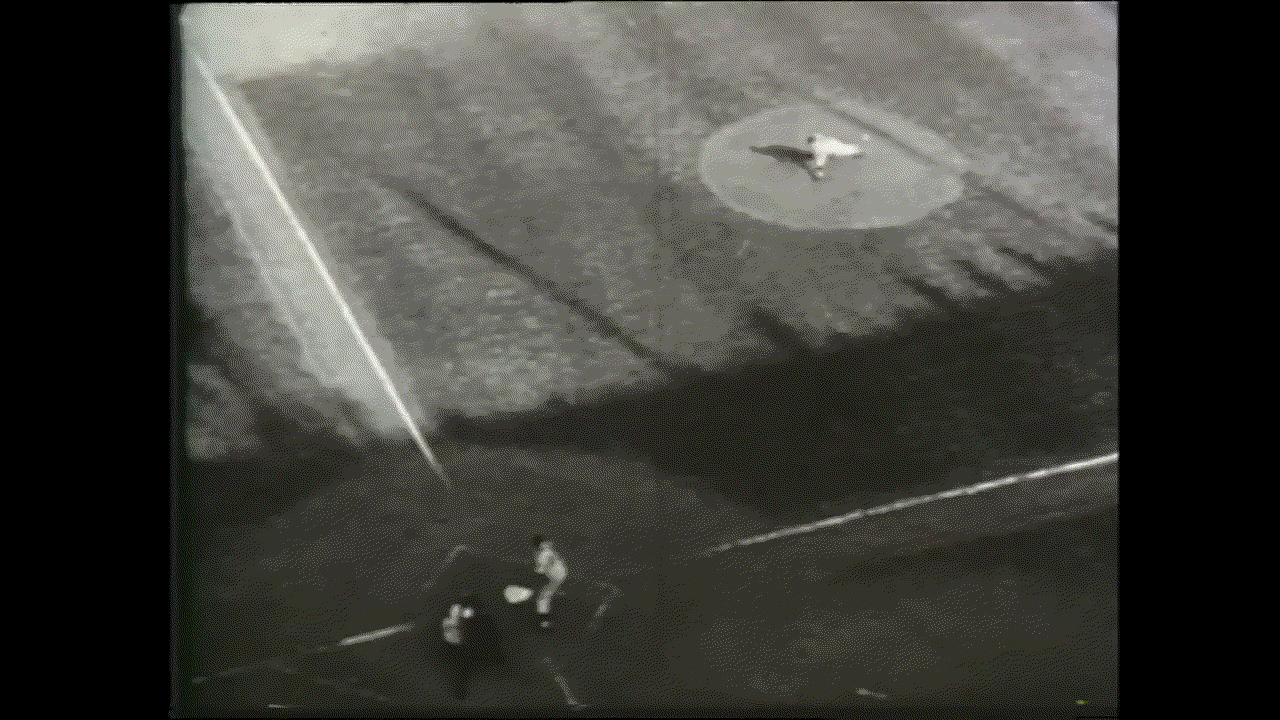
In other words, if we could pinpoint either the spin rate or the launch angle, then we would get a unique solution for the trajectory. We thus need to find a way to break this degeneracy. Again, as was the case for my Daryl Strawberry home run analysis, this is where footage of the ball leaving the bat comes to the rescue. Below is an animated GIF showing a few frames right after the ball contacted Vic Wertz’s bat.
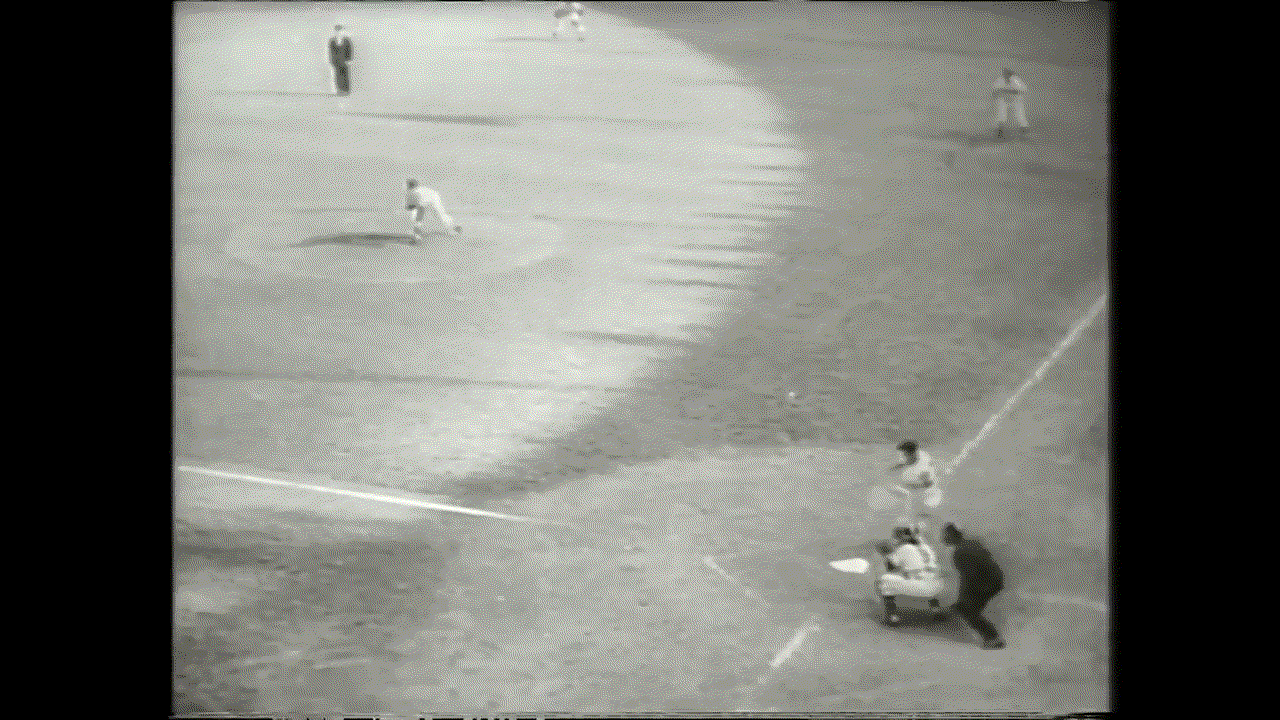
From the ball trail in the frames above, I was able to measure an angle of about 69 degrees with respect to a horizontal line. However, this does not mean that the launch angle was 69 degrees, as the camera is elevated and at an unknown distance and angle from the play. In my Strawberry home run analysis, the camera was far enough that a simple orthographic projection was a good approximation. In our case here, the camera is relatively close (about 100 feet), and a perspective projection must be done.
Briefly, I extrapolate the line from the camera position to a given point on a plane defined by its normal (i.e., the pointing direction of the camera, which is taken as the vector that goes from the camera to the location on the infield that is in the middle of the image). For example, I extrapolate the line from two points on both the first base and third base lines and then calculate the angle between the lines those pairs of points make on the plane. The angle between the first base line and the third base line measured in the image is about 122.5 degrees (90 in reality), the angle between the third base line and a horizontal line is about 8.5 degrees, and the angle between the pitcher’s rubber-home plate line and a third base line is 26.5 degrees (45 in reality). I now need to find the camera position that reproduces all those perceived angles.
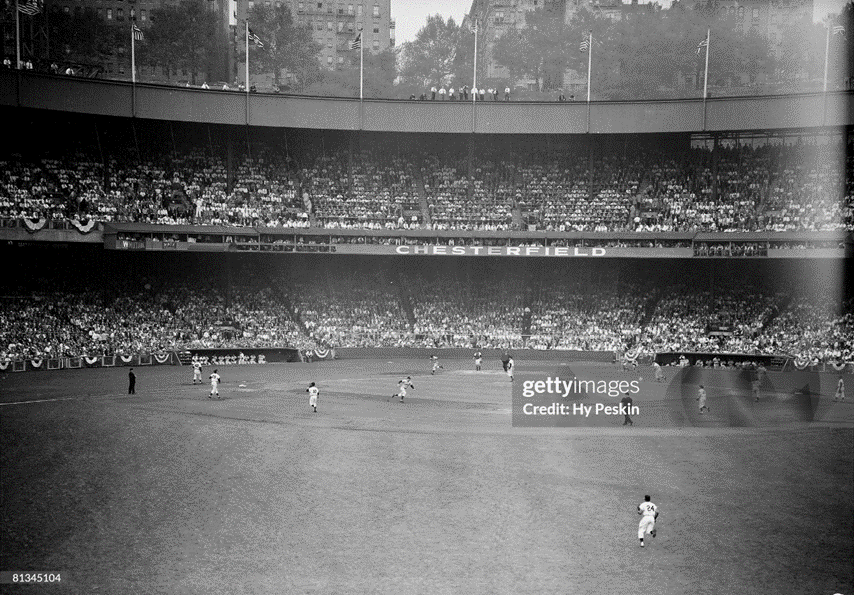
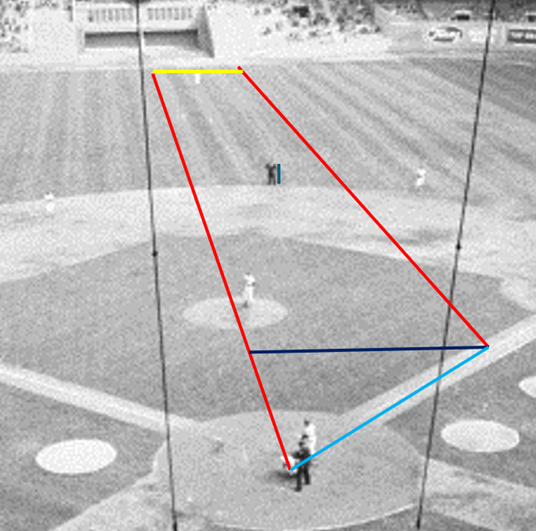
From the archived gettyimages photograph below, one can see that the camera was positioned slightly towards the third base side of the press box.
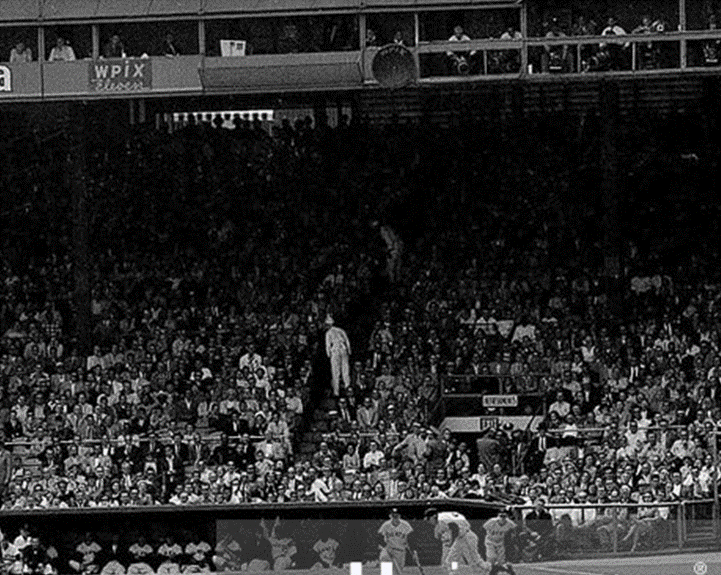
Furthermore, from this other image below, I was able to estimate the height of the camera to be about 35 feet (assuming the vendor is 6 feet tall, the camera is 26 feet above his feet. Adding another 9 feet as he is in the 10th row or so gives 35 feet). I also estimate that the camera was about 100 feet from home plate (backstop was listed at 74 feet and about a dozen rows must be added to be under the press box).
The exact values are not critical at this point; I just need an approximate location to place the camera and then adjust it until all the perceived angles I calculate match those measured in the image. By doing so, I was able to reproduce all the angles within 0.1 degrees with the camera situated at a diagonal distance of 99 feet, at an angle α=20.85 degrees, and ϕ=29.15 degrees.
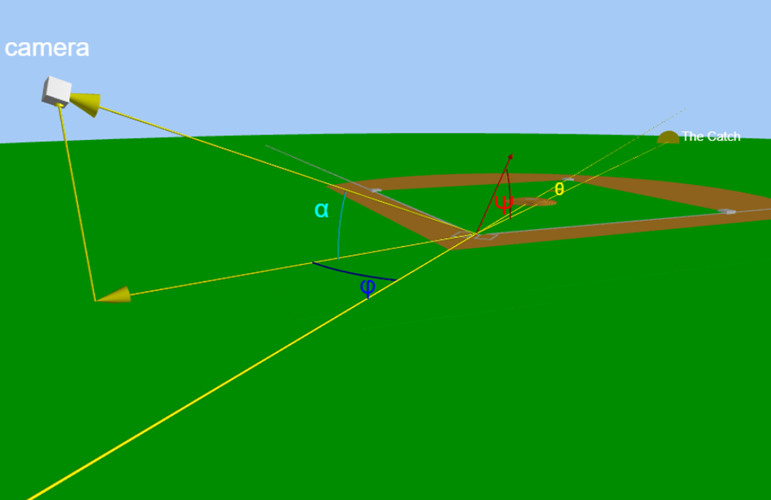
The line going from the catch location to home plate makes an angle θ with the home plate center field line. To estimate this angle, I examined a photograph where stripes can be observed in the outfield grass. These stripes do not seem parallel in the picture due to perspective, but they are straight and parallel in reality.
The line parallel to the stripes going from the approximate position of the catch in front of the wall to the first base line crosses at about 2/3 (say approximately 60 ± 5 feet) of the distance between home plate and first base (light blue line). The perpendicular distance between the center field line and the catch position (yellow line) is the same as the dark blue line. From simple geometry, this distance is cos(45)×60=42 feet, give or take a few feet. Hence, the angle θ is asin(cos(45)*60/421)= 5.8±0.5.
Now that the camera position is established, it is time to determine what launch angle corresponds to the 69 degrees measured in the footage. The answer will also depend on the spray angle. If the ball was hit with pure backspin, it would not swerve to the side, and the 5.8 degrees estimated above would be the spray angle. However, pure backspin is just a simplifying hypothesis, and there is no guarantee this is the case.
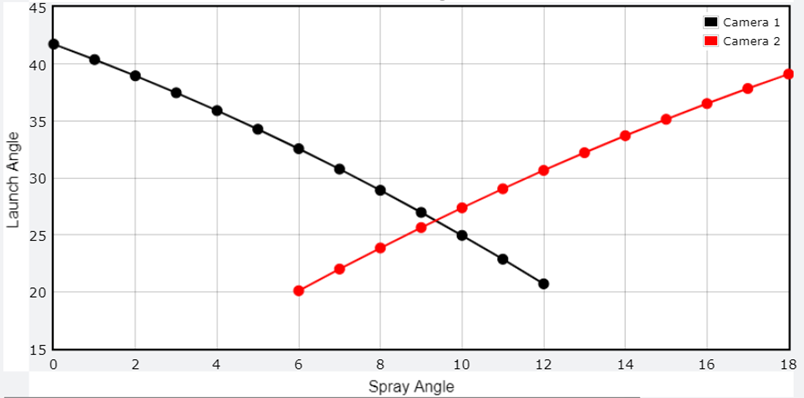
To cover all possibilities, I calculated the perceived angles from the camera for various spray angles as a function of the launch angle. The intersections of these curves with 69 degrees are the allowed possibilities (black dots). If the spray angle is indeed about 5.8 degrees, then the figure below indicates that the launch angle was around 33 degrees. From the hang time as a function of launch angle figure above, the spin rate would have been 1440 rpm (with a corresponding exit velocity of 102.2 mph). However, it could have been another spray angle, and some side spin or wind might have caused the ball to swerve back to its final location. Therefore, multiple combinations of launch and spray angles are possible. If only we had a second camera view from another angle to resolve this ambiguity…
But wait! We do have another view at 35 seconds in the YouTube video link at the beginning of this post. This second camera view is from a much steeper angle, indicating that it was probably situated on the top of the second deck.
Applying the same method as for the first camera, I was able to reproduce all the angles (as before, angles between the first base line and third base line, a horizontal line, and the pitcher-home plate line) with the camera situated 143 feet away at an angle α2=41.8 degrees and ϕ2=27.2 degrees.
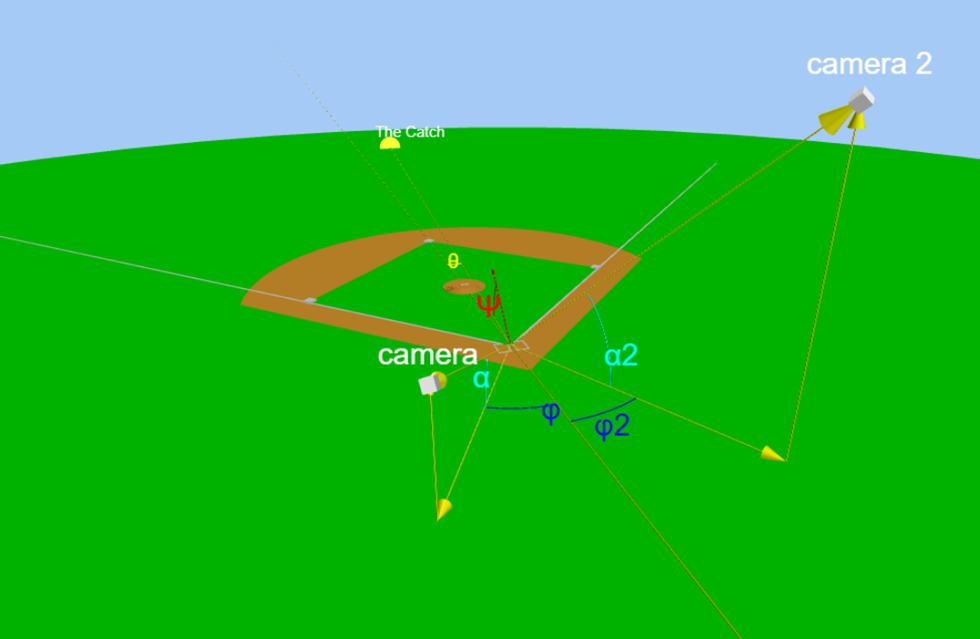
Next, I calculated the launch angle that corresponds to the measured angle (60 degrees with respect to horizontal line) for various spray angles. In doing so, I was able to resolve the degeneracy between launch and spray angles and found that the solution is for a spray angle of 9.4 degrees, a bit more than the pure backspin hypothesis of 5.8 degrees. The corresponding launch angle, spin rate, and exit velocity are 26.2 degrees, 3520 rpm, and 105.6 mph.
Note that changing the drag coefficient by 5%, well within the modern measured variations, results in a change in the derived exit velocity by about 2 mph. Considering all the uncertainties (various angles, mass and radius of the ball, air density, lift coefficient, etc.), I would estimate that the exit velocity can only be determined within about ± 4 mph. This estimate does not account for potential influences such as wind and/or sidespin.
Interestingly, in the frames from the second camera, we can observe the ball traveling in one direction initially, and then changing direction after it is hit. In both cases, the ball travels approximately the same distance. I counted 11 frames for the ball traveling in and 8 frames for the ball traveling out. This means that the pitch was thrown at approximately 8/11 * 105.2 = 76.5 mph. However, considering an uncertainty of at least one frame in these counts and the 4 mph mentionned above, the error on this pich velocity comes out to about 12 mph.
All that said, according to my analysis, the ball must have swerved a bit to the left. Sidespin becomes the primary suspect, but since balls hit by a lefty tend to swerve to the right, a more plausible scenario is one where a small wind contribution pushed the ball to the left. I find that a 6 mph wind blowing toward left field brings the ball back to it’s catched location (a 500 rpm sidespin would also work). I could continue trying different combinations of sidespin and wind, but I believe I have pushed this useless detailed analysis far enough. Below is my trajectory simulator set with the final parameters I derived. Feel free to change the assumptions but whatever you do, you must make the ball land in the red circle in 5.7 seconds. Have fun!