Overlooked video evidence of Darryl Strawberry’s legendary home run at Olympic Stadium provides new insights into the launch angle. Using this data and modern trajectory simulations, the distance the ball would have traveled can be re-evaluated, uncovering surprising results.
On Monday, April 4th, 1988, Darryl Strawberry blasted what is considered one of the longest home runs in baseball history (see, for example, lists of well known long shots here, here and here). The ball did not actually clear the fence but instead hit the concrete service ring 160 feet high—a remarkable achievement that only occurred twice during the Expos’ 1977-2004 tenure at Olympic Stadium.
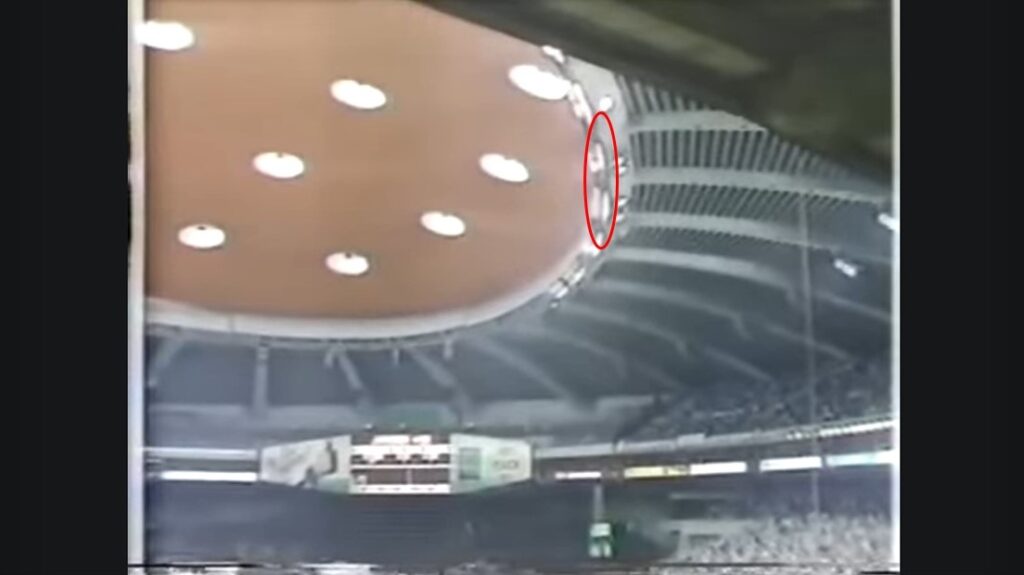
A decade earlier, Mets slugger Dave Kingman had been the first player to hit the concrete service ring, but since the ball escaped the view of the third-base umpire, it was controversially called foul at the time. It was later decided that orange « Kingman lines », running from the top of the foul poles to the service ring, would be painted, and any ball hitting the ring in fair territory would be declared a home run—something realized only once 11 years later by none other than Darryl Strawberry (source).
Here is a video of this historical shot:
« It was the longest home run I ever saw. Longer than any I saw playing with Henry Aaron or Frank Robinson or Sadaharu Oh in Japan. » –Manager Davey Johnson
The next day, the Olympic Installations Board asked McGill University physicist Robert More to estimate the distance the ball would have traveled if unimpeded. According to his calculations, the ball would have traveled between 500 and 550 feet. The Expos arbitrarily split the difference and called it 525 feet, and thus, a legend was born!
Would that ball really have traveled 525 feet? It is tempting to say that we will never know for sure, as measurements of exit velocity, launch and spray angles, and spin rate—none of which were available back in 1988—would be needed for a more robust analysis. When asked to estimate the distance, Dr. More probably did what any good physicist would do and « guesstimated » some of the parameters to arrive at his numbers. Looking at it more than three decades later, given that no home run has ever been hit further than 505 feet in Statcast history, it’s likely that some of his assumptions were slightly off. At the same time, it is certainly difficult to blame him for this, as the concept of exit velocity, drag coefficient, launch angles, and such weren’t part of baseball jargon back then. Furthermore, he likely only did some back-of-the-envelope calculations, as it’s doubtful he had access to numerical trajectory simulations back in 1988 to quickly respond to the Olympic Installations Board’s request (the 500-550 feet estimate was published in the April 6th edition of The Gazette).
So, 36 years later, is there anything new we can say about all this? I believe the answer is yes, thanks to a small, overlooked piece of evidence I recently noticed. What is it? Looking at the video right after Darryl Strawberry makes contact with the ball, I noticed a small diagonal ball trail in the image.
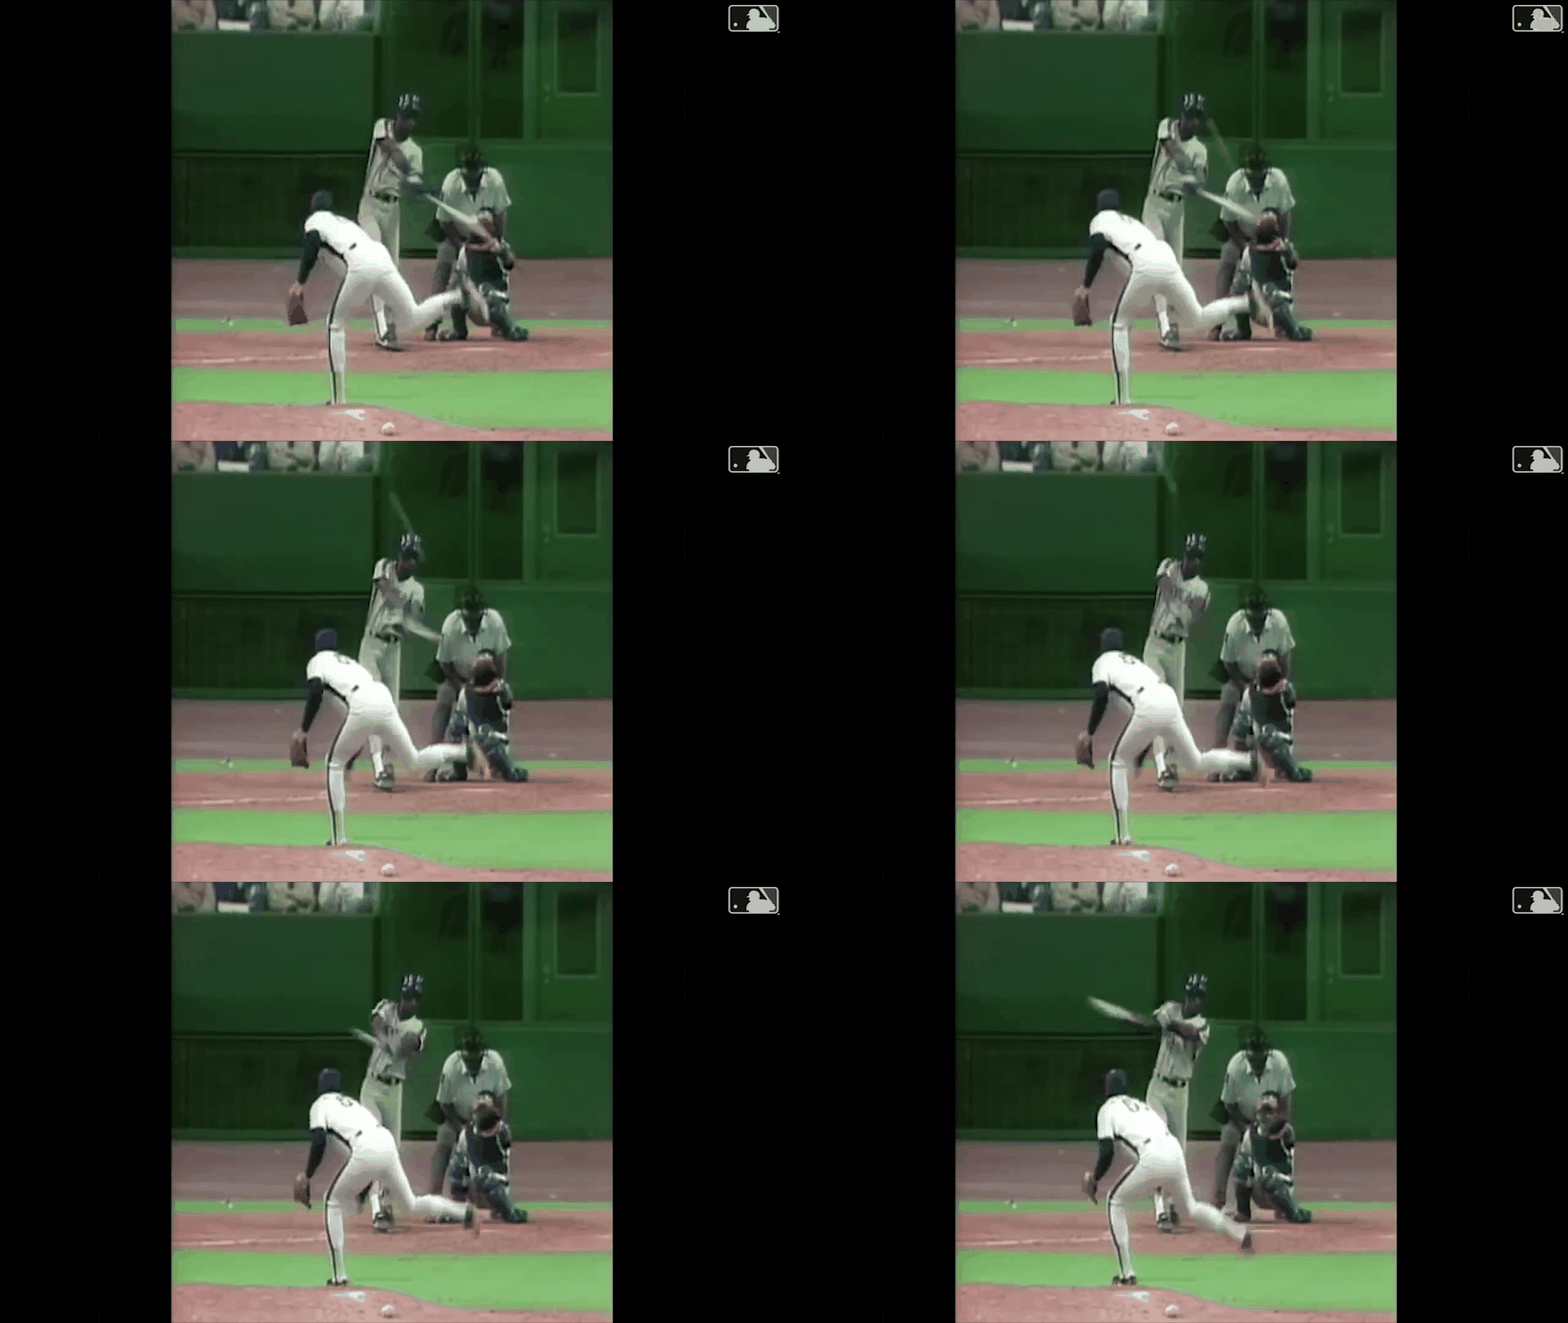
This is all I needed to be able to shed some new light on this historical event. Why? Because it provides information about the launch angle of that hit!
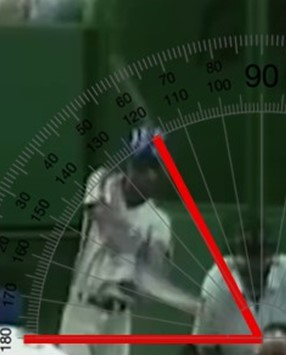
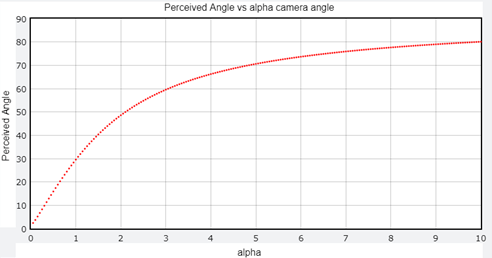
From the image above, I was able to measure an angle, with respect to the horizon, of about 62 degrees. This, of course, does not mean that the launch angle was 62 degrees since we are watching it from an unknown azimuthal angle from a camera in the center-left field. For example, if the ball was launched directly in the direction of the camera, then the perceived angle would have been 90 degrees, while if it was launched perpendicularly (in which case the ball would go into the crowd), then the measured angle would be exactly the launch angle. Thankfully, using some simple trigonometry, it is possible to calculate the perceived angle by a camera as a function of azimuthal angle for various launch angles. The figure below shows the result of such calculations as well as the crossing of those curves with the measured 62 degrees mentioned above.
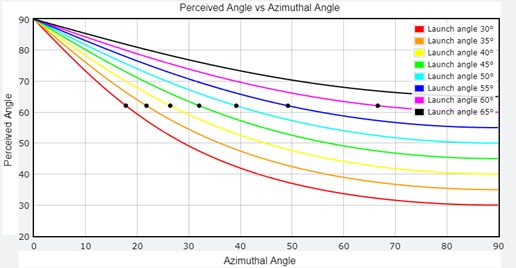
This means that if we could somehow determine the azimuthal angle, we would know the launch angle of that moonshot. Then, using my trajectory simulator, it becomes possible to estimate the maximum distance this ball could have traveled (provided some reasonable assumptions on the exit velocity and spin rate).
So, what is the azimuthal angle? There are actually two components to it. First, we define an angle phi (φ) to be zero if the ball is hit straight to center field and 45 degrees if hit over the first base line. Unfortunately, when the camera view shifts to the field, the ball is not visible in the video footage. But we do see all the players, including the second baseman and right fielder, turning and looking up in the direction of the first base line. From this, one can easily estimate that the phi angle is somewhere between 35 and 45 degrees. However, I believe that values close to 45 degrees are unlikely, as balls initially hit straight over the first base line tend to have side spin that makes them curve into foul territory, so the ball was more likely hit somewhere between 35 and 40 degrees.
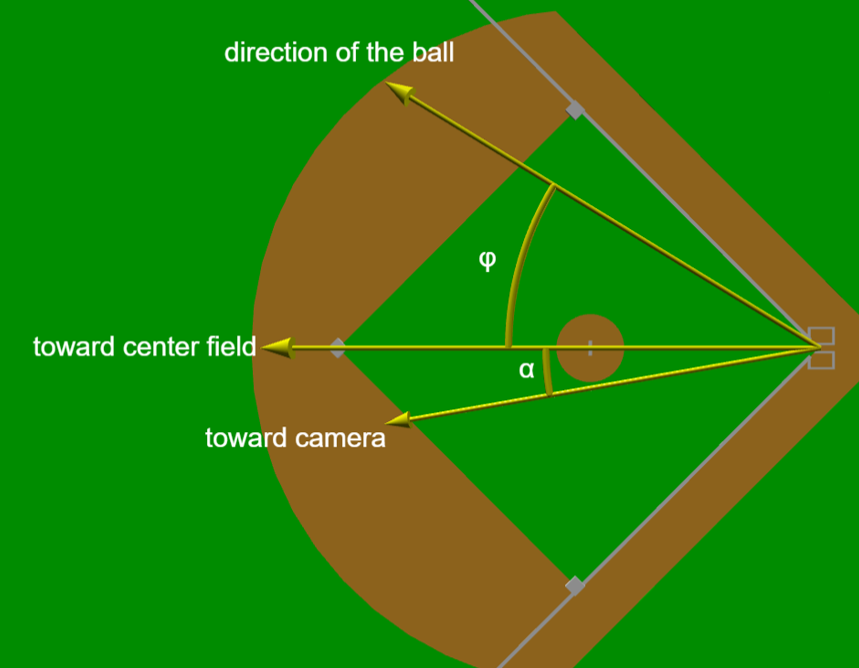
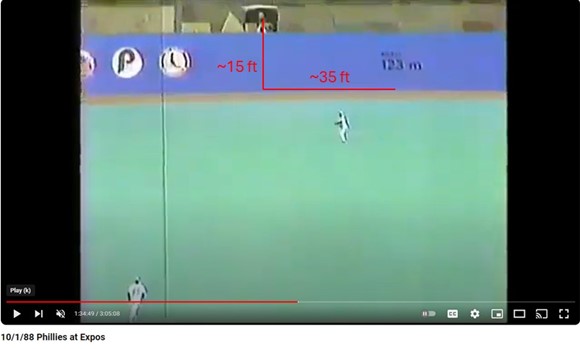
Next, we must consider that the center field camera is slightly offset toward left field to view the pitched trajectory at an angle. This angle, let’s call it alpha (α), must be added to phi to get the real azimuthal angle. I estimated this angle alpha in two different ways. The first method consists of finding directly the position of the camera in some other game footage. I was able to find on YouTube a game between the Expos and the Phillies where, thanks to the known height of the fence, I was able to estimate that the camera was about 400 feet away, offset by about 35 feet from the center field. Thus, the angle alpha is about 35/400*180/pi = 5 degrees.
It is also possible to estimate the alpha angle by measuring the angle that the pitcher’s rubber-home plate line makes with a vertical line.
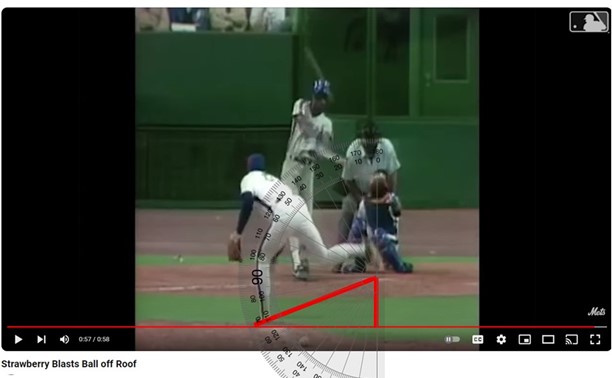
In the image above, the measured angle is about 69 degrees. If the camera was directly behind the pitcher in center field, then this angle would, of course, be zero, and it would gradually increase as you move the camera toward the left field. With some mathematical operations that I will spare you the gory details of (if you have learned to master trigonometry and linear algebra, it is a fun intellectual exercise that I recommend), it is possible to relate this perceived/measured angle to the real alpha angle that the camera-home plate line is making with the pitcher’s rubber-home plate line.
The perceived 69-degree angle measured corresponds to an alpha angle of about 4.8 degrees, in excellent agreement with the first method. So, I am comfortable using 5 degrees for the rest of this analysis.
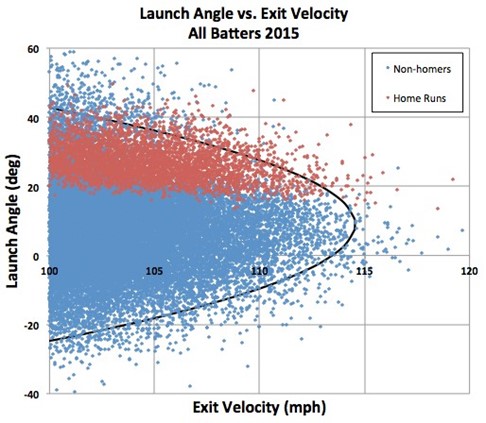
This allows us to estimate that the azimuthal angle is phi (35 to 40) plus alpha (5), which is about 40 to 45 degrees. According to the Perceived Angle vs Azimuthal Angle figure above, this means the launch angle had to be between 51.1 and 53.6 degrees. This is extremely steep, but this is what you need to be able to reach 160 feet high. In fact, launch angles below 40 degrees could already have been ruled out, as such trajectories do not get high enough unless the exit velocity is very high. Indeed, according to my trajectory simulator, an exit velocity of at least 112 mph is needed for a 40-degree launch angle, and 122 mph for 35 degrees. The relationship between the launch angle and exit velocity for all batters in 2015 (other years since are very similar) has been discussed in detail by David Kagan in an excellent FanGraphs article. As shown in his figure reproduced below, the likelihood of a ball with those characteristics being hit is very low, even for someone as extraordinary as Darryl Strawberry in his prime.
Moreover, given the perceived 62 degrees angle that is measured, the Perceived Angle vs Azimuthal Angle figure indicates that ball hit with launch angle less than 40 degrees must be hit with a launch direction (spray angle) of less than 21 degrees or so, in contradiction to the direction the players were looking up.
Now that we have established that the launch angle was most probably in the 51.1 to 53.6 degrees range (give or take a degree or two depending on real launch direction and camera position), what does it take to have a trajectory that will intersect with the concrete ring at Olympic Stadium? To explore this, I added a 575×340 foot elliptical ring at a height of 160 feet in my trajectory simulator. The region where the ball likely impacted the ring has also been highlighted in red, and if the trajectory of the ball crosses this region, the curve display increases in size. Also shown is the center field camera view and the perceived angle from that point of view. A given choice of launch angle must be accompanied by an appropriate launch direction (and vice versa) to be compatible with the observed perceived angle of 62 degrees. Display of the trajectory is updated 7 times per second, so you can immediately see the effect on the trajectory as you change the parameters by moving one of the various sliders.
click on image bellow to open trajectory simulator
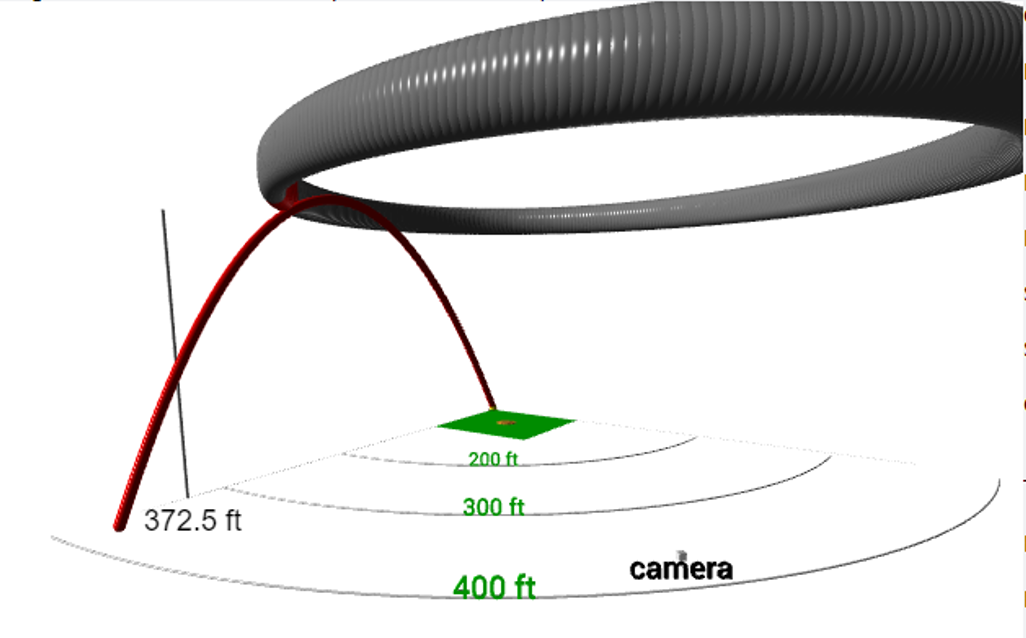
If the launch angle was 51 degrees (with a corresponding launch direction of 35 degrees), with some side spin, it is possible to hit the ring with a reasonable exit velocity of around 106 mph, depending on the assumed values for the spin and air density (you can play with the sliders and see what works for yourself). Such an exit velocity is rare at this launch angle but not unheard of, so it is not impossible that a 6-foot-6 athlete like Darryl Strawberry could have achieved it.
However, depending on the exact spin rate, such a high fly ball would only travel around 370 feet according to my simulator, far short of Dr. More’s 1988 estimate. For slightly higher launch angles, the required exit velocity decreases a bit, but so does the traveled distance. For lower launch angles, as mentioned earlier, the problem arises that you don’t get the necessary height and/or the launch direction is too close to center field to be a viable possibility.
Finally, it’s worth mentioning that since 55,413 fans attended this opening game of the season, the stadium’s ventilation system had to be cranked up to 100% capacity to prevent the inside temperature from exceeding 30 degrees. Players have noted over the years that strange wind patterns occur up there when the system is on. It’s unfortunately impossible to quantify exactly how this could help carry the ball (it certainly did, as seven home runs were hit that day), but even assuming such currents were equivalent to a relatively strong 10 mph wind, my trajectory simulator indicates the ball would have traveled ‘only’ about 50 feet further—still 100 feet short of the 525 feet estimate logged in the record book. And if those wind current somehow played a role pushing the ball up, then the exit velocity could have been much less, but the ball would still not have traveled much more than 400 feet or so. I’ve experimented with various parameters and haven’t found a realistic combination that approaches 500 feet. There are, of course, many uncertainties associated with the above analysis, with room to adjust the exact values of each parameter. Nevertheless, it can be stated with almost absolute certainty that there’s no way a ball hit with such a high launch angle could have traveled as far as 525 feet. The optimal launch angle for distance is actually much closer to 25-27 degrees, depending on exit velocity and spin rate, and such balls don’t reach 160 feet high (or travel 500+ feet, for that matter), period.
Sorry Darryl, physics just blew you away.
